Our Oceanside Water
  • Home
  • Facts/Stats
    • Local Tide Guide
    • Terminology
    • History of Our Water Use
    • Water Quantity
    • Water Quality >
      • Existing contamination risks
    • Water Source Protection
    • Water Testing
    • Education
    • Private Wells
  • Our Community's Water
    • Upland storage a better option
    • City Of Parksville
    • Town Of Qualicum Beach >
      • Qualicum Waterfront
    • RDN Electoral Areas F, G, H
    • Englishman River Water Service >
      • New Water Treatment Plant Aquifer Storage
      • Water Treatment Questions
      • Arrowsmith Lake
      • Other Water Supply Options
      • The Clay Banks
    • Other Private Utilities
  • Environmental Topics
    • Our Land
    • Estuaries
    • Watersheds/ Rivers and Creeks/ Lakes / Wetlands >
      • Englishman River System
    • Our Climate
    • Groundwater
    • Groundwater Levels
    • Hydrology
  • Water Related Subjects and Links
    • Englishman River Estuary
  • Water Management/Governance
  • Groundwater Licencing
  • Opinion Blog
  • ContactMe
  • About the Authors
    • NAVIGATION
  • Hydrologic Impact Zone
  • Evapotranspiration Potential
  • 26,000 Days
  • Home Draft
  • Urban Water Waste

Precipitation and Climate 

Changing Precipitation

Precipitation on the North-East side of the Mt. Arrowsmith range, varies from an annual average of 200 cms in the high elevations, to 95 cms near the coast.
Generally the heaviest rainfall occurs during November and December near the coast, while highly variable snow pack amounts occur at higher elevations. Regional climate change is likely to result in lower snow levels in winter, earlier springs, warmer low humidity summers, and later drier falls.


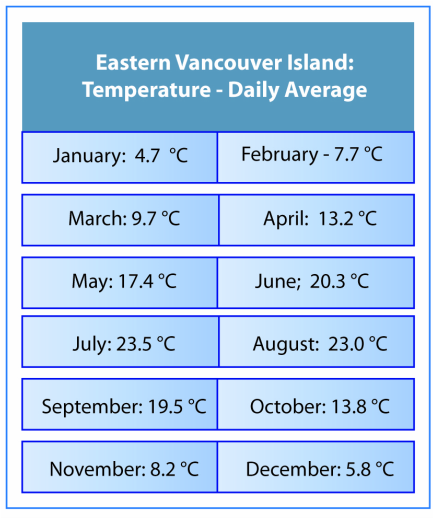
 Climate Statistics


Average hours of sunshine - 2,047 hours annually
Average water temperature of ocean - 12°C
Average precipitation - 95 cm. annually

City Of Parksville Climate Statistics

Picture
Click The Drip


​City of Parksville monthly rainfall 

Picture
​
​The Mountain Snowpack on Vancouver Island is very important to the overall hydrology. The seasonal snow melt can extend the surface runoff well into the summer months, maintaining river levels and groundwater recharge.
Picture
Picture
​ This graph is the nearest to this area No. 3B23P at Jump Creek south-west of Nanaimo
This graph shows the variability of snow from year. Note the almost nonexistent snow pack for last winter 2014 - 15.
Picture


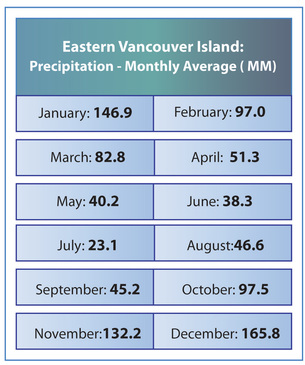
A wide variation of precipitation in this part of Vancouver Island. 

Late November and December are typically the wettest months.

​Summer months can have extended periods without rain.


Home

About

Blog

Contact

Written by Trevor Wicks